#UIdesign #DataVisusalisation #Charts #Prototype
Applied Works
The UNIDO Industrial Analytics Platform (IAP) is a powerful tool that provides data on key industrial development indicators, along with expert research, in an user-friendly format.
Our team was responsible for conceptualizing and designing two interactive hero charts for the redesigned Analytics section of the IAP website. These charts, which focus on the key themes of "Production" and "Competitive Industries," are the focal points of two dedicated pages. Each chart is not only visually engaging but also serves as a gateway to a curated collection of related data, offering users a deeper understanding of the trends and insights surrounding each topic.
The design was carefully crafted to ensure intuitive navigation, with the charts dynamically updating to provide real-time, context-rich information. Additionally, the layout and functionality are optimized for seamless use across all devices, ensuring accessibility for a global audience.
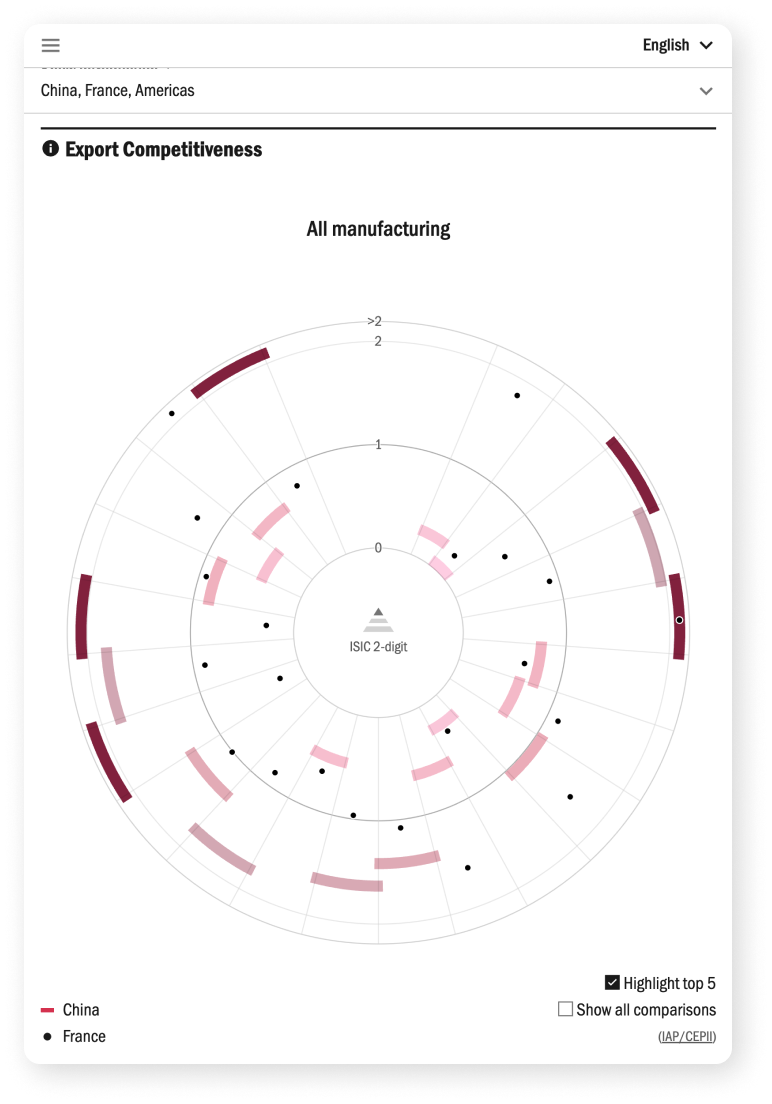
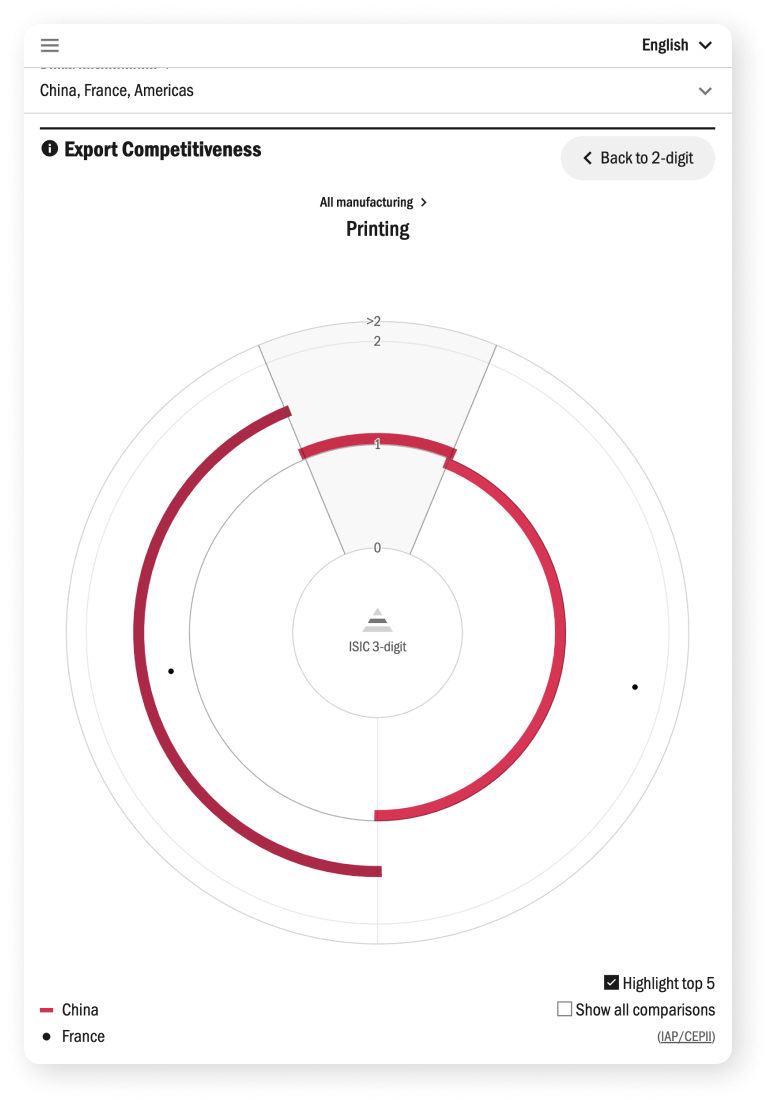
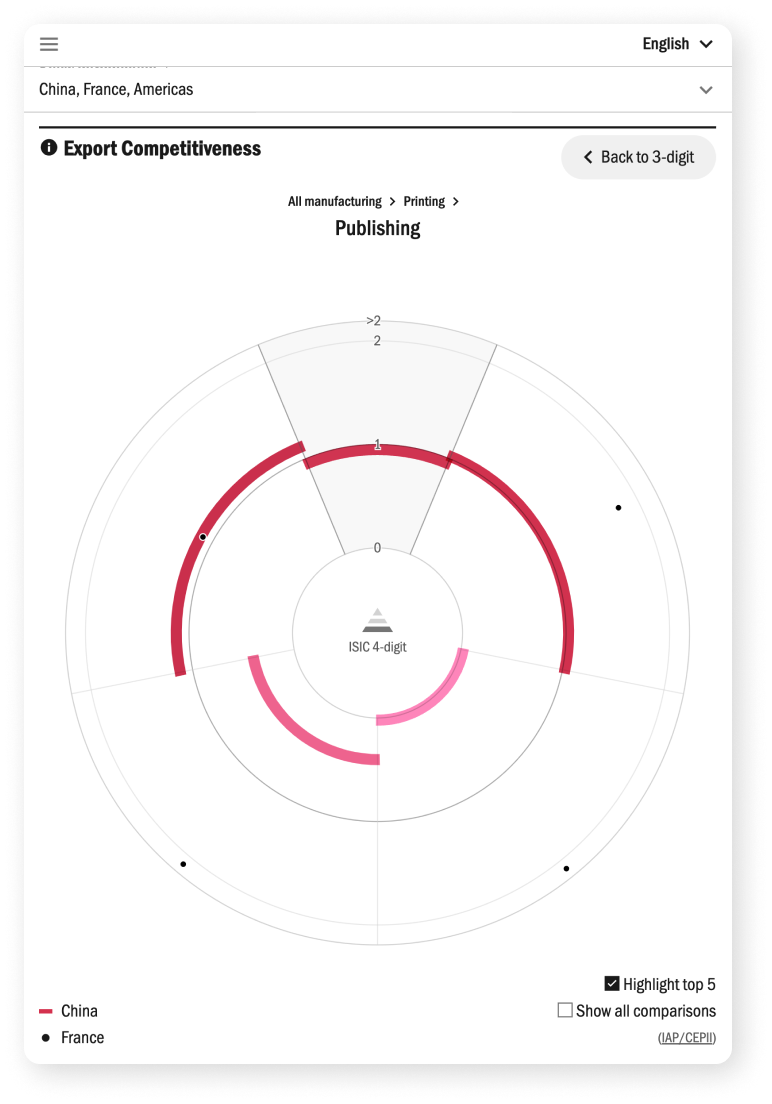
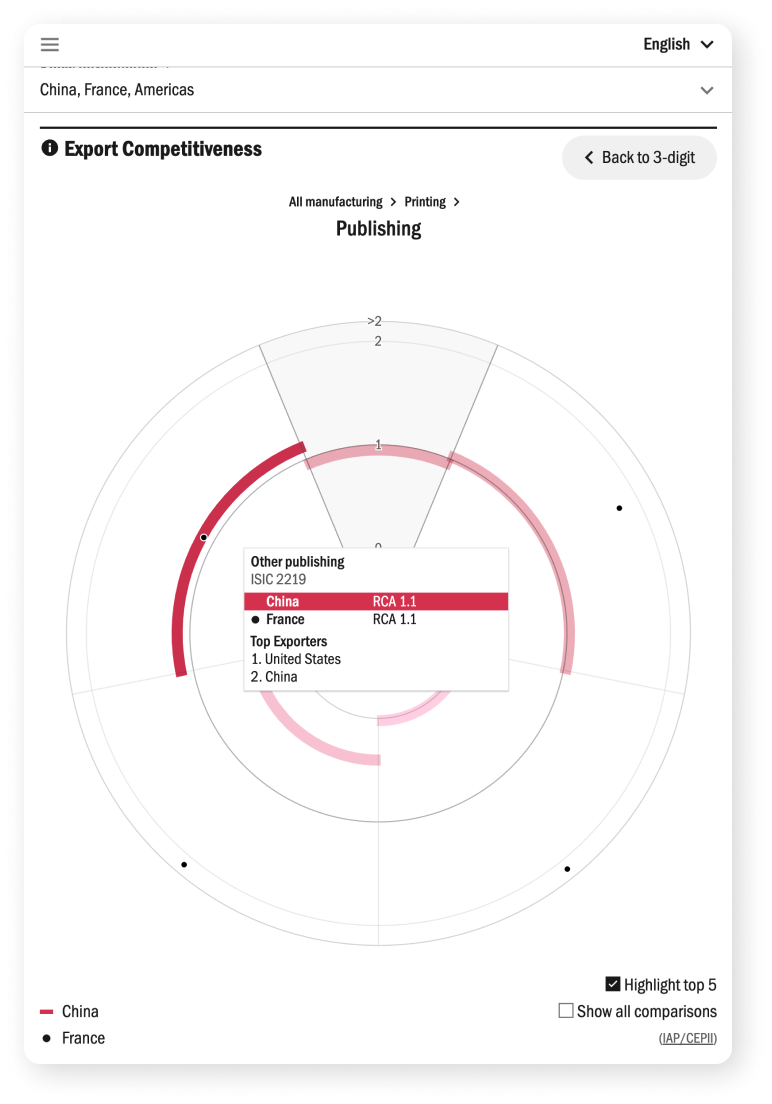
This interactive chart provides users with the ability to explore the competitiveness of a selected country’s manufacturing exports in detail, down to the 4-digit level of the International Standard Industrial Classification (ISIC) code. By analysing data at this granular level, users can gain a comprehensive understanding of the country’s export performance across various manufacturing sectors, identifying which industries are thriving and which may require strategic attention. Additionally, the chart offers a global comparison, enabling users to assess how the selected country’s manufacturing exports stack up against those of other nations.
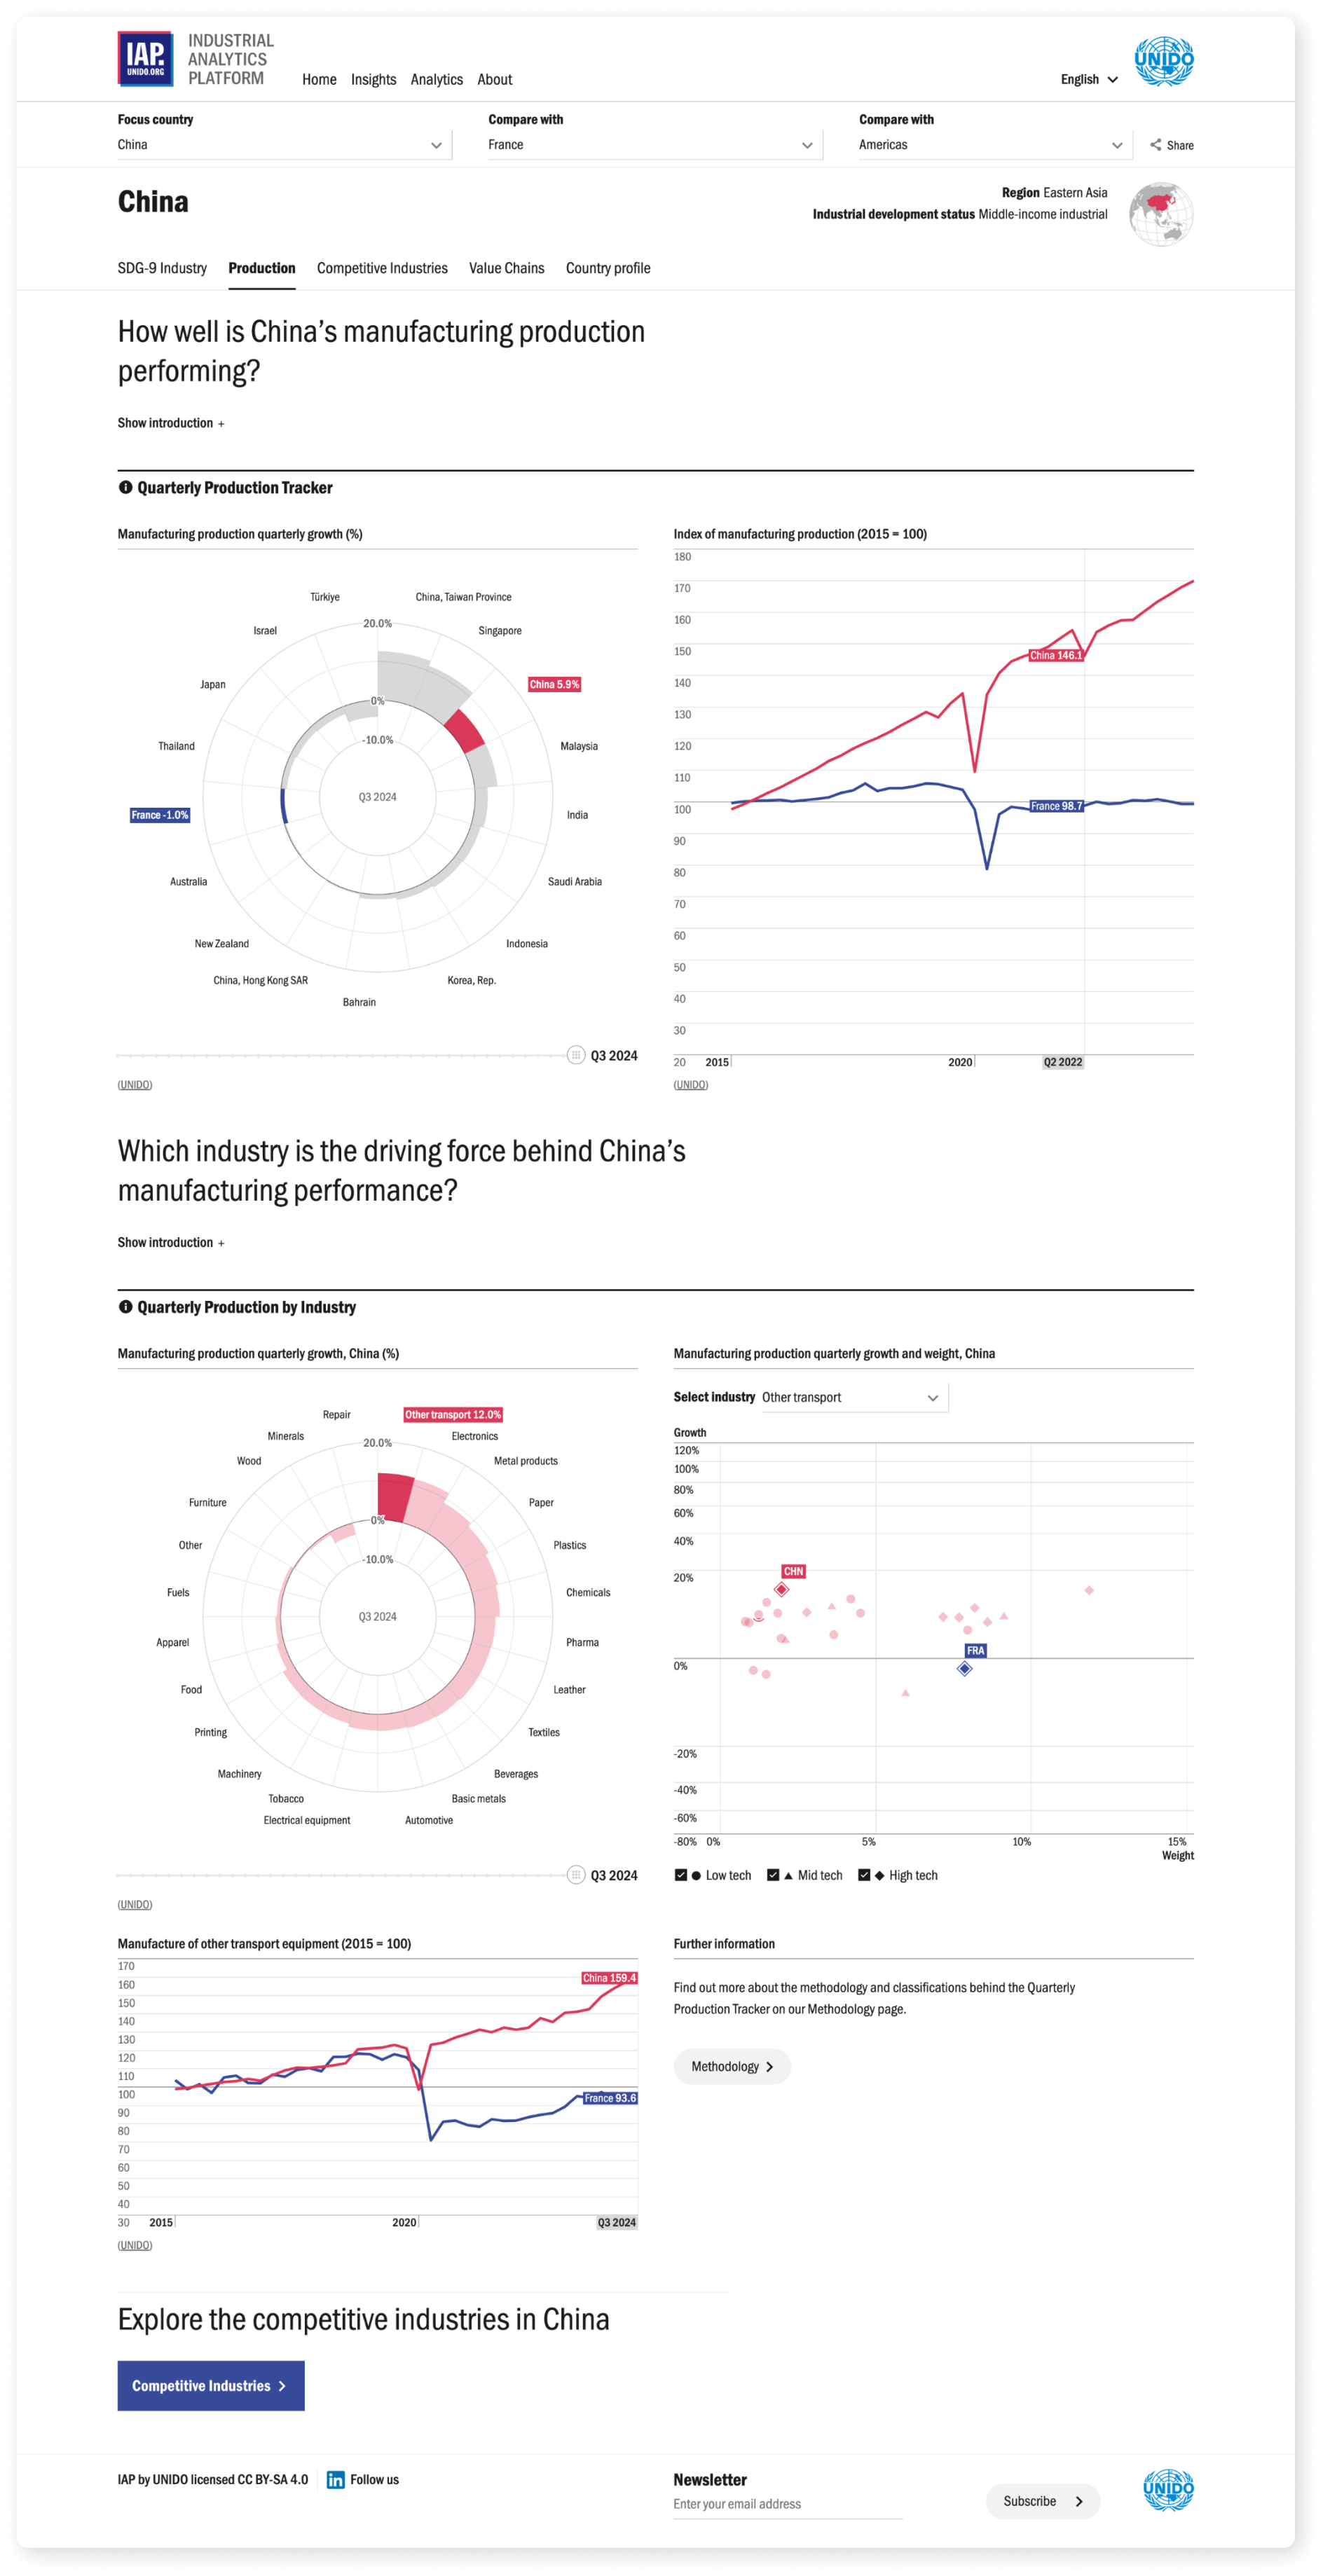
The quarterly production tracker features two spiral charts: one displaying data by country and the other by industry. Each chart is complemented by a line chart and a scatter plot, respectively. The country-based production tracker enables global comparisons and serves as a filter for the industries shown in the lower section of the page. Both charts include a time-based selector, allowing users to explore data by quarter.